Blog
Refactoring code with `flir`
How to efficiently rewrite many code patterns.
Using property-based testing in R
When you don't want to write dozens of versions of unit tests.

Making POST requests with R
An alternative to RSelenium to get data from dynamic webpages.

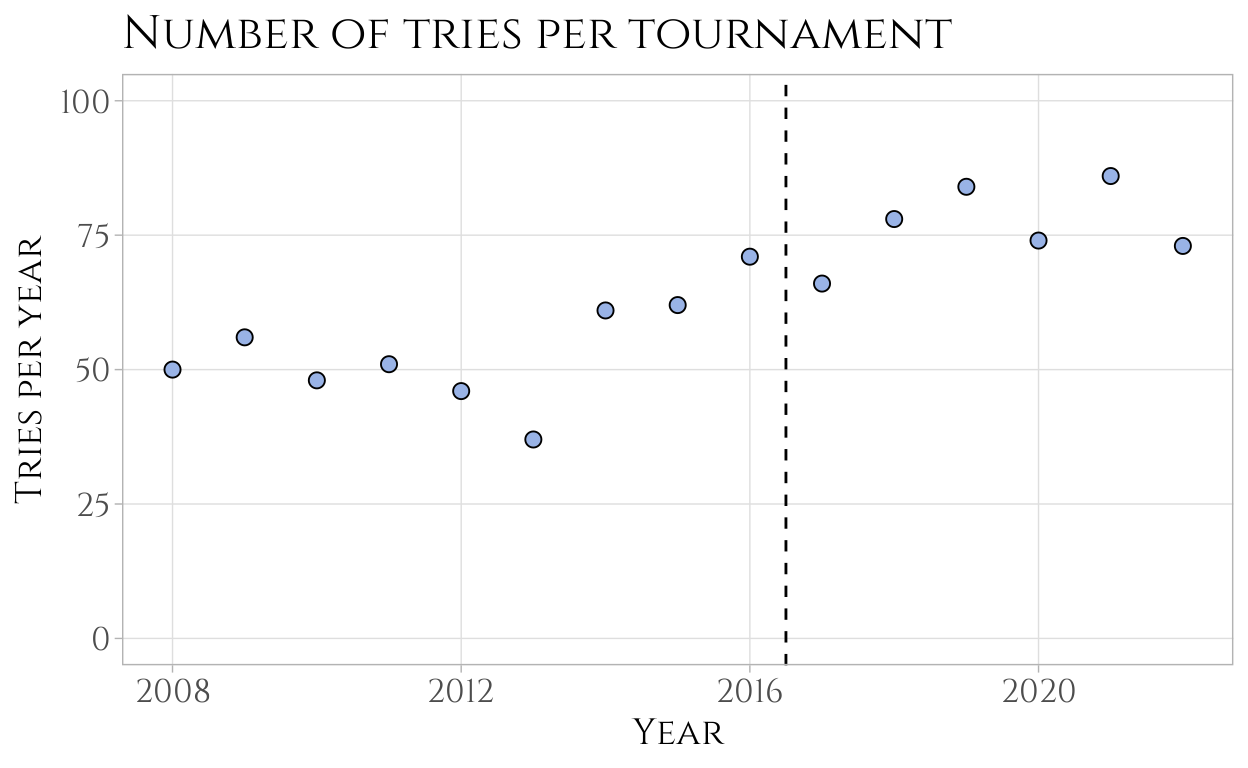
Do bonus points lead to more tries in 6 Nations matches?
A small post where rugby is an excuse to do some webscraping and some `ggplot`-ing.

Where should my family meet?
Or a mathematical way to evade the debate on the location of the next holidays.

Some notes about improving base R code
A small collection of tips to make base R code faster.

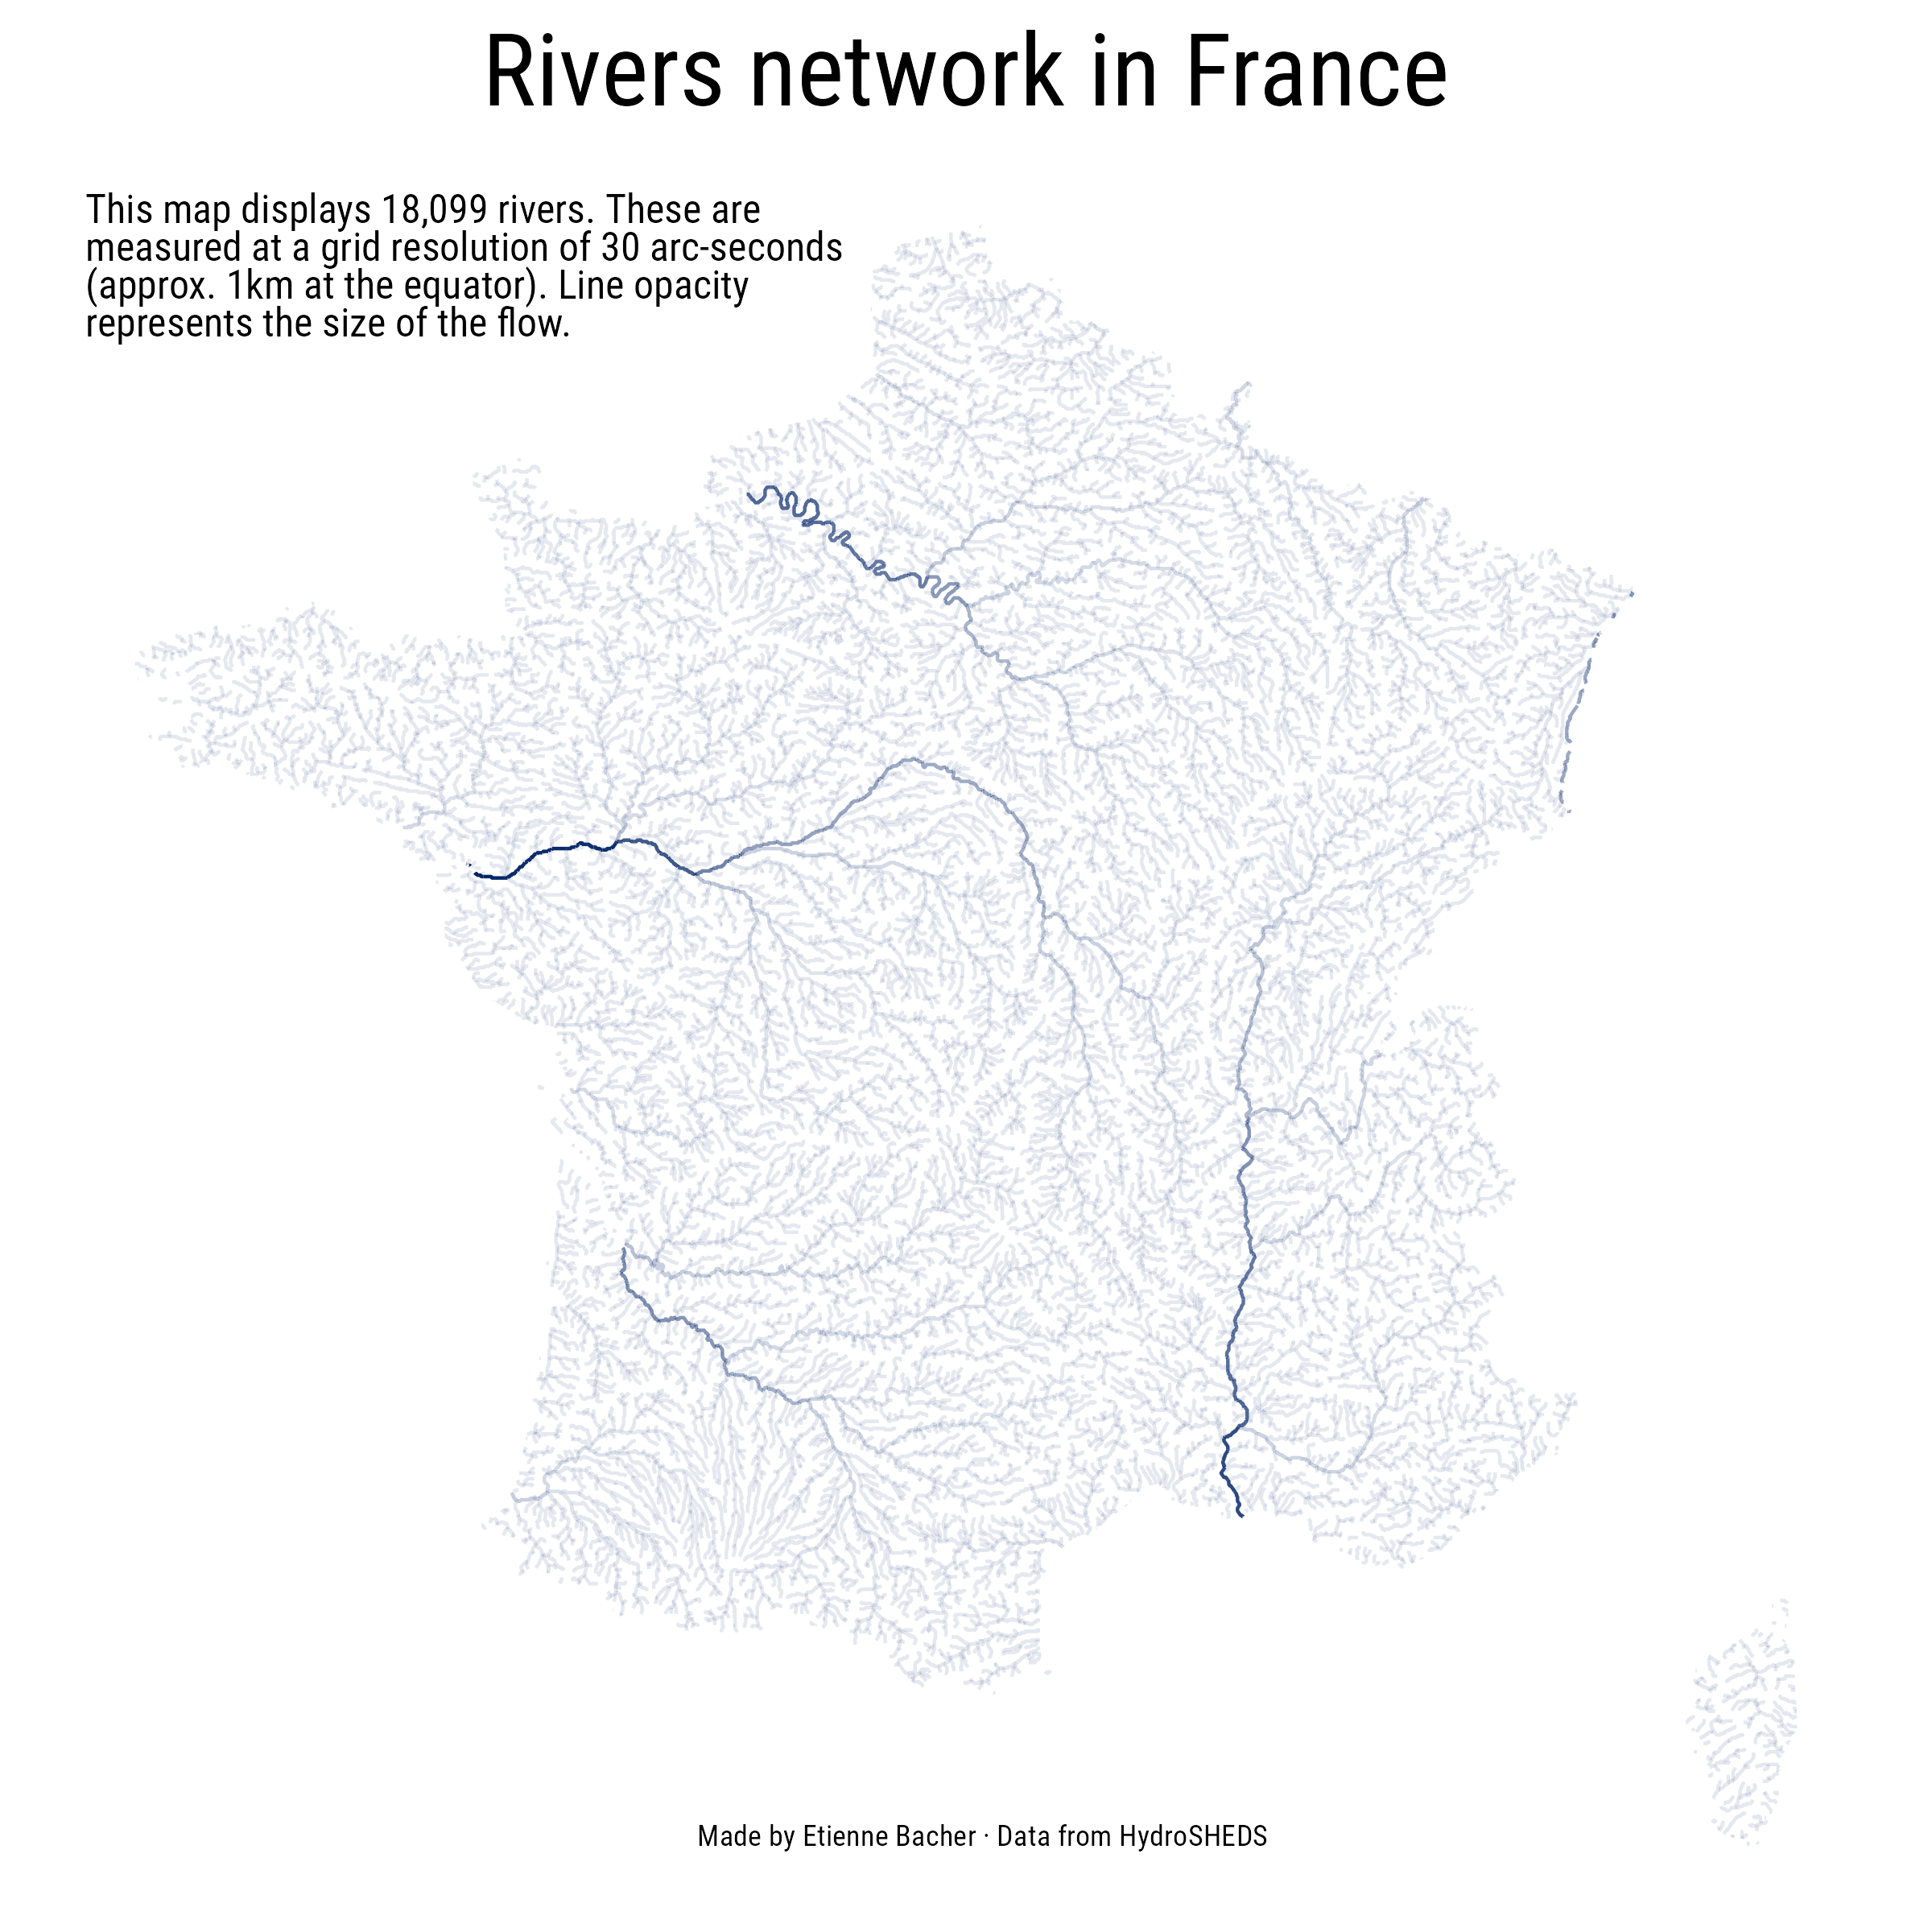
Mapping French rivers network

Reproduce some maps about 3G and 4G access
I try to reproduce some maps made by Dominic Royé.

How to create a gallery in Distill
Use lightgallery.js to create a gallery for your plots or images.

Use GitHub actions with R Markdown and Distill
How can you automatically render README, Distill website...
Compare two languages in R Markdown documents
A few months ago, I tried to compare two languages in an article. Here are several ways to do it.

Visualize data on Nobel laureates per country
A post where I make animated graphs and maps to visualize the repartition of Nobel laureates per country.

Text analysis of the dialogues in "The Americans"
I love the TV show "The Americans" and decided to harvest and analyze the dialogues.
Writing a Master's thesis with R Markdown and Bookdown
I wrote my Master's thesis with bookdown. This post contains some tips to modify the layout and other stuff.
What to do when your code doesn't work?
This is the list of actions I make when I have an error in R.
My application for the Shiny Contest (2020)
A presentation of the application I submitted to the Shiny Contest 2nd edition.
My favorite shortcuts in RStudio
Did you know that RStudio contains a lot of shortcuts to write code faster? Here are my favorites.

First contact with the data on R
A blog post describing the first steps of data cleaning and analysis using R.
Why you should move from Stata to R
Some reasons that explain why I prefer R to Stata.